Using Registrations Performance
Registrations Performance is available from the left hand panel. You can access it by clicking on the performance tab

.
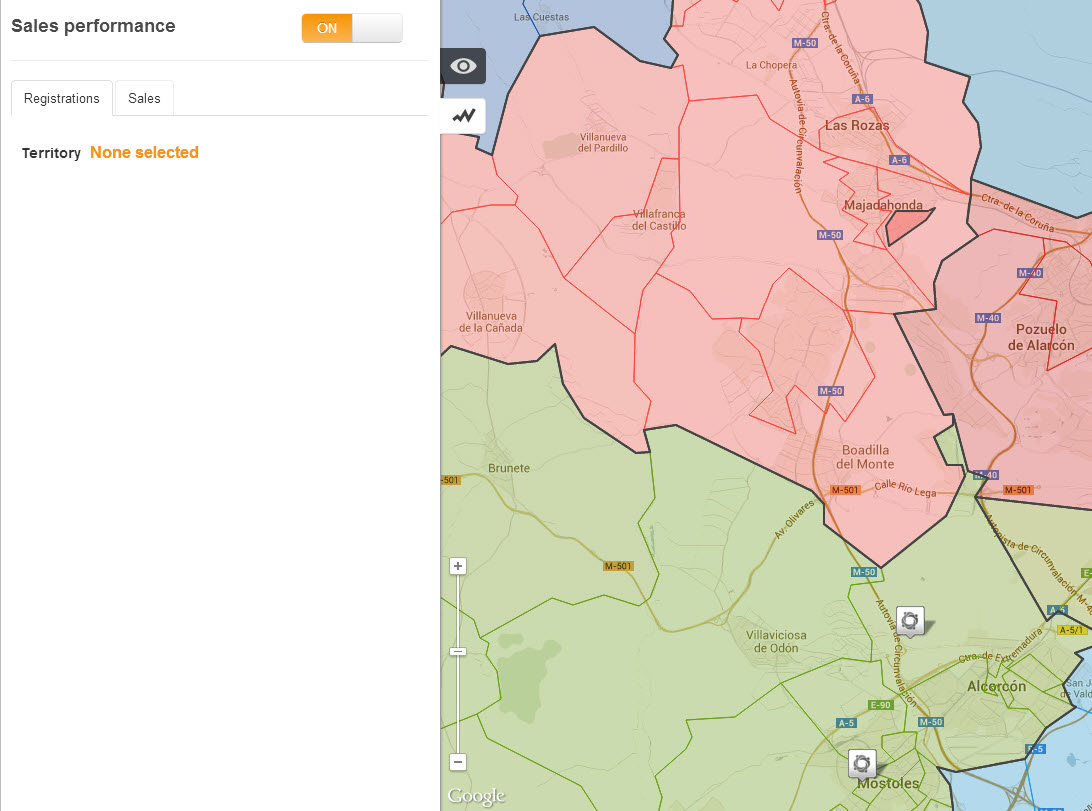
Once you have opened the panel, switch on using the on/off button. Default territories will automatically load and display on the map.
Note that there are two tabs within the panel, one called Registrations and one called Sales.
Registrations
This option will show brand performance for you and your competitors in any territory that you select.
Sales
This option will show outlet or dealer performance for any outlet / dealer that you select on the map.
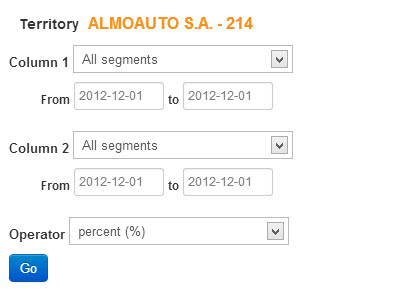
Select a territory by clicking on it on the map. (you can select more than one territory by pressing the shift key and clicking on another territory). You now have access to the data picker in the panel. This allows you to select the registrations data that you want. Above the panel, you can see the name of the territory selected in orange text.
You have the choice to select data for three columns.
Column 1 - select the registrations segments that you want - leave this as 'alll if you want all segments. Select the time period that you want from and to
Column 2- repeat the same for column 2 if you want to populate this column
Operator - the operator goes into column 3. You can use a number of options with this:
a) add (+) - this will add the values in column 1 and 2
b) subtract (-) - this will subtract the values in column 2 from column 1
c) percent (%) - this will calculate the percentage of values in column 1 as a percentage of the values in column 2
d) market share ([%]) - this is a speacial operator which automatically places the totals for column 1 into column 2 and then calculates the market share
Once you have selected your data, click on the 'go' button.
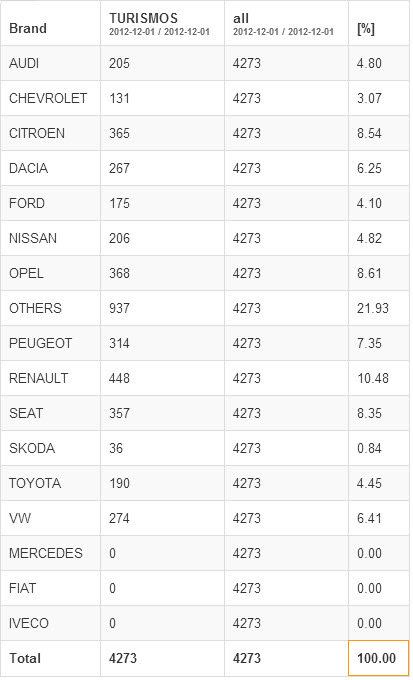
Registrations Table
If you have selected the registrations tab, you will see the registrations table displaying the data that you have selected. This will show the registrations for all the represented brands. The segments that you selected will be shown at the top of each column, and the operator you selected will also be shown.
In this example, you can see registrations for the selected territory for the represented brands and for the segments that you selected. The operator selected is market share. When this happens, column 2 will be filled with the total (sum) of column 1 in order to calculate the share figure. If you slected data for column 2 it would have been replaced by this.
Now try clicking on another territory - you will see the figures change in the table. You can select more than 1 territory by clicking shift and select. The selected territory names will appear in orange near the top of the panel.
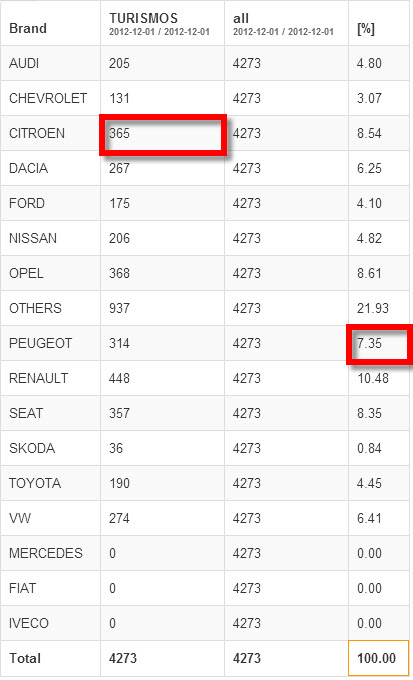
You can now select any value in a cell in the table. For example, in the table above, we could select the cells which have been outlined in red. If we select the first one ( this is the cell for Citroen and the Turismos segment for the dates shown), we will see the registrations for Citroen in the Turismos segment by postcode (geography) all over the map; Look at the map shading as you select this cell.
Now try selecting the other cell which is the market share for Peugeot. This will now display the Peugeot Market Share for the Turismos segment for the dates shown on the map across the country. This two-way functionality allows you to keep powerful control of looking at registrations performance both in a table and a visual representation on the map.